
The analysis factors in homes owned outright and with mortgages, alongside social housing and the private rented sector.
It shows that overall housing value increased by £136bn during 2025, although this marked a slowdown on the previous year, when £268bn was added.
The total value of UK housing
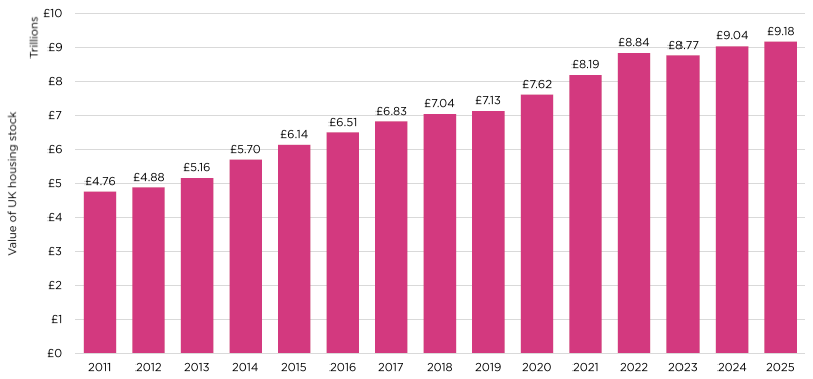
Source: Savills Research
“Although the total value of UK housing has continued to edge up over the past year, the capital appreciation of £336bn since the end of 2022 is the lowest we have seen for a three-year period since 2013,” said Lucian Cook, head of residential research at Savills.
“That partly reflects the initial pressure put on prices as mortgage costs rose over the course of 2023. But equally the housing market has been slow to respond to recent cuts in bank base rate. This combined with an absence of price growth across London and the South East, where values are highest, and falling levels of house building has kept a lid on the aggregate number.”
The housing market across the North of England and the devolved nations has delivered stronger growth than the South in recent years, despite representing a much smaller share of overall property value.
Together, these areas account for just 27% of the total value of UK housing stock, yet they have driven 60% of all market growth since 2022.
The standout performer has been the North West, where the total value of homes has risen by £63bn over the period — around 2.4 times the £26bn increase recorded in London and £24bn more than the £39bn added in the South East.
“Regional performance continues to reflect the fact, from a geographical perspective, we are well into the second half of the housing market cycle.” said Dan Hill, senior research analyst at Savills.
“There remains more capacity for growth in more affordable markets of the North, Scotland, and Wales, while in London and the South that continues to be more limited.”
“However, housing wealth remains heavily concentrated in London and the South East. These regions command a disproportionately large share of total UK housing value relative to their share of the housing stock, an imbalance that continues to define the UK housing market.”
Regional values and changes £bn
| Total value in 2025 | 3 year change | 10 year change | |
| London | £2,041,323,344,609 | £26,399,575,336 | £489,944,566,941 |
| South East | £1,701,948,553,427 | £39,345,580,105 | £513,263,418,214 |
| East of England | £989,752,809,271 | £6,260,713,429 | £310,217,703,752 |
| South West | £843,601,628,261 | £15,134,257,776 | £286,965,065,273 |
| North West | £732,531,875,912 | £63,329,745,195 | £312,928,314,565 |
| West Midlands | £625,631,685,508 | £24,572,459,494 | £242,557,935,704 |
| Scotland | £539,709,081,138 | £37,331,506,837 | £202,667,554,313 |
| East Midlands | £521,963,174,530 | £23,620,467,159 | £206,598,210,757 |
| Yorkshire & the Humber | £503,473,342,502 | £37,722,815,656 | £195,978,838,476 |
| Wales | £309,449,531,936 | £13,605,620,576 | £126,438,977,633 |
| North East | £195,604,143,789 | £18,957,290,589 | £69,369,867,945 |
| Northern Ireland | £172,468,500,727 | £29,643,483,920 | £81,930,006,513 |
| United Kingdom | £9,177,457,671,611 | £335,923,516,073 | £3,038,860,460,087 |
Source: Savills Research